
Cookieless Tracking with TYPO3 Analytics: Unravel User Behaviour in Your System

Up to 80% of your visitors go uncounted. Learn in this article why descriptive metrics usually fall short and how integrated behavioural analytics closes the gaps.

The 80% You Can't See: Why Behavioural Analytics Needs to Live Inside Your CMS
Your dashboard shows rising visitor numbers. Dwell time looks solid and unique users keep growing. So everything's fine? Not necessarily. Between 30% and 80% of your visitors never show up in conventional analytics tools. And for the ones that do get counted, you usually only know that they were there, not what they did.
That matters, because if you steer content, campaigns or a whole website by these numbers, you're making decisions on data full of blind spots. This article shows where those blind spots are, why behavioural analytics is the key to insights you can rely on, and why it works best as a solution built into your CMS rather than a third-party tool bolted on top.
Blind Spot #1: The Visitors You Never Measure
The problem isn't only what you measure. It's also who. Most setups capture only a fraction of the audience, and that fraction is not a random sample. Four things stand between you and your audience:
- Consent rejection. Visitors who decline the cookie banner become invisible.
- Ad blockers. Roughly a third of German internet users run an ad blocker. Most block analytics scripts as well as ads.
- Browser restrictions. Safari, Firefox and Brave block tracking cookies by default, and other browsers are following.
- Self-inflicted loss. A cookie banner you don't technically need suppresses traffic you're legally allowed to measure.
Every metric on your dashboard, from unique users to conversion rate, is based on a distorted slice of your audience. Privacy-conscious visitors, for example, are systematically under-represented.
The "GDPR-friendly" Trap
Many tools sold as privacy-friendly or GDPR-compliant still drop a cookie on the visitor's device. The logic is simple: if a tool needs a consent banner, it stores or reads something on the visitor’s device, and everyone who declines the banner disappears from your numbers. "GDPR-compliant" describes the legal side. It says nothing about how much of your traffic you actually see.
Go ask your vendor one question: Does your tool require a consent banner? The answer tells you how big your blind spot will be.
Data sovereignty is the other half of the question:
- Where is the data processed? That means hosting, backups and support access. "EU only" has to cover all three, not just the main database.
- Who else has access? Which sub-processors are involved, and which of them fall under non-EU law?
- What is stored on the device? A tool that stores nothing on the visitor's device has far less to worry about.
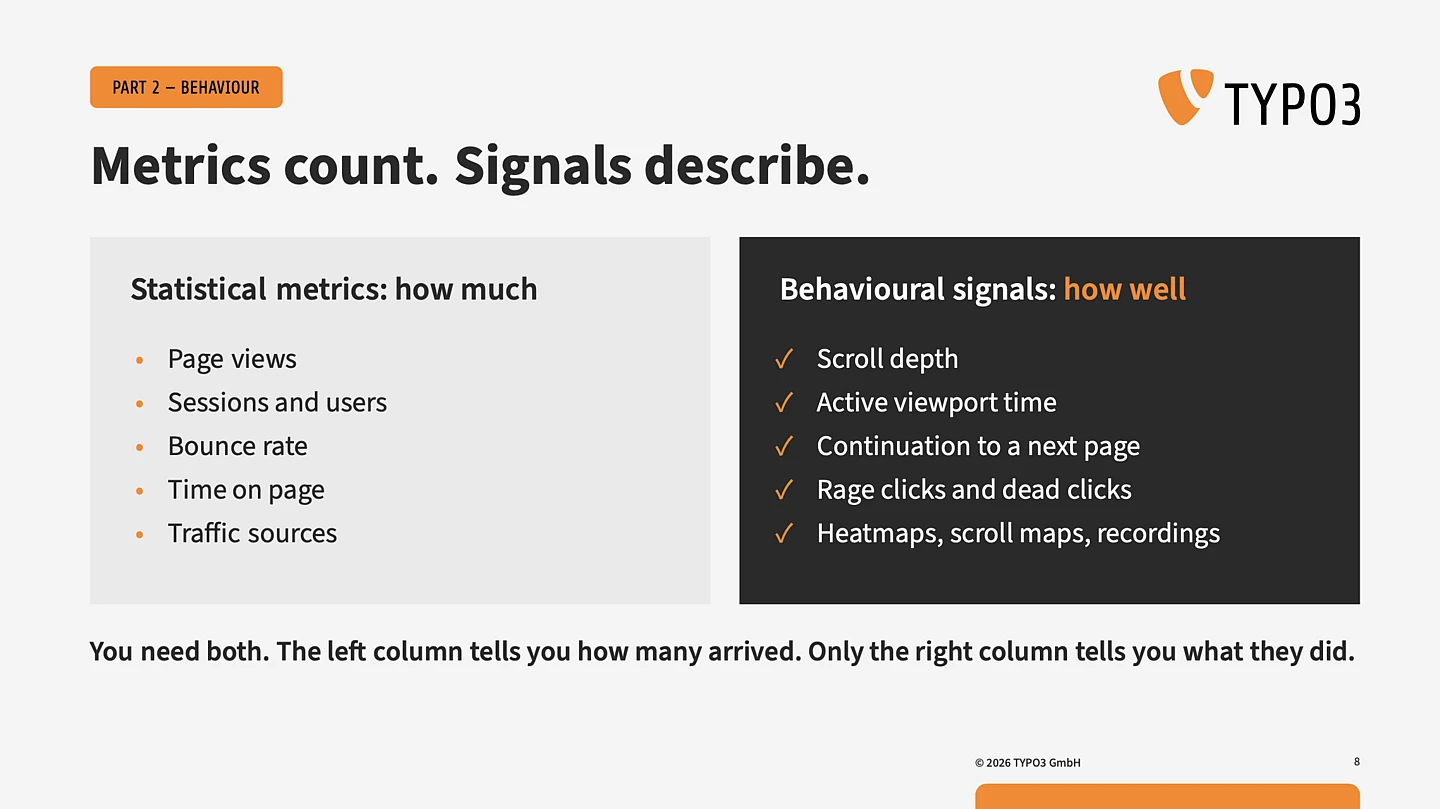
Don't Trust Time On Page
Time on page looks like a behavioural signal, but it isn't one. Take two visits:
- 20 minutes: A reader opens your article in a tab and goes to lunch.
- 90 seconds: A reader goes through every word carefully and leaves satisfied.
Judged by time on page alone, the first visit looks better. Only scroll depth combined with active viewport time shows whether the content was actually read.
The most underrated signal in content measurement is continuation: does the visitor keep going on your site after reading? It's the difference between a dead end and a doorway.
Your Best Page Is Often Your Worst Page
When you look at traffic, engagement and outcome together, some familiar assumptions don't hold up:
- High traffic, low scroll depth, no click-through: The page gets attention but doesn't answer the visitor's question. Traffic-only reporting calls it a success, yet it's often the biggest missed opportunity on your site.
- Low traffic, high scroll depth, high click-through: A small entry point that leads almost everyone deeper into the site. Traffic-only reporting ignores it completely, even though it shows what your audience actually wants. That's where you should do more.
Seen this way, nearly every page on your site fits one of a few patterns, and each pattern has its own fix. At that point measurement becomes strategy rather than reporting.
Blind Spot #2: Counting Isn't Understanding
Complete data is the starting point, not the insight. Traditional web analytics answers "how many?". Behavioural analytics answers "how much did it matter?", and that's where you find out whether content works.
Three Questions Every Page Should Answer
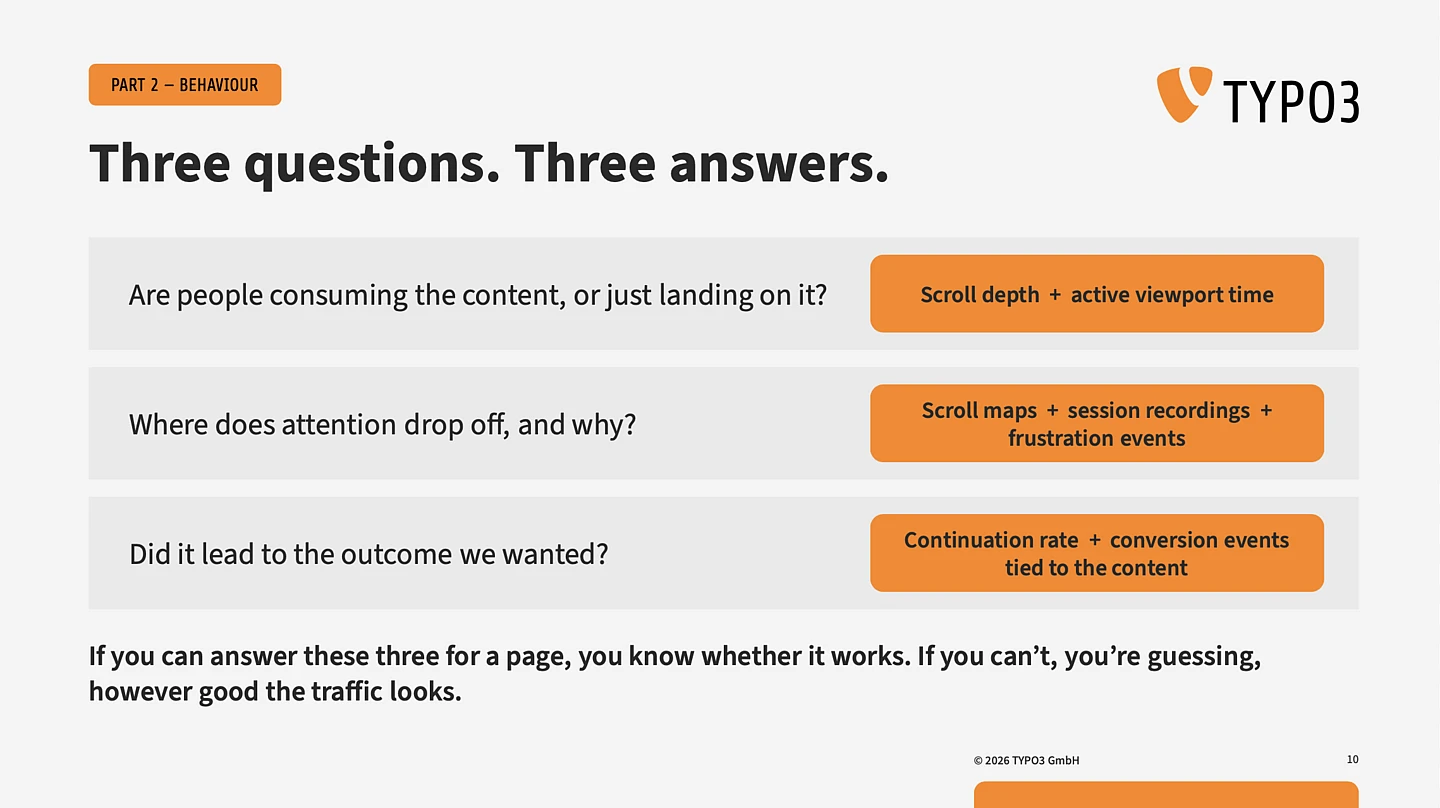
There’s a simple way to assess whether your user journey is working or whether it’s leading to drop-offs and frustration. Analyzing your analytics data in isolation may yield impressive numbers, but this data is useless if you can’t identify specific patterns between the lines.
Combining the right analytics data, on the other hand, often provides clarity on how users interact with your website. By answering the following three questions (shown in the image), you’ll learn what works and what doesn’t.
Blind Spot #3: AI on Top of the Wrong Data
Analytics is shifting from passive (dashboards you check, reports that describe the past) to reactive (measurement that tells you what to do next and then checks whether it worked).
That has led many teams to the same shortcut: connect analytics data to an LLM through an API or MCP, then ask it what to publish next. The answers sound fluent, confident and specific. They're still not reliable, for three reasons:
- A snapshot instead of a baseline. The AI only sees exported numbers, not your history. Without a median for each page, it can't tell you whether 300 views this month is strong or weak.
- Prompt dependency. An answer is only as good as the question. Very few people think to ask how scroll depth relates to click-through on high-traffic pages.
- Unreliable maths. Ask for pages performing 50% above your median and the calculation may simply be wrong, and the AI won't say so.
Points 1 and 3 come from how these tools work, so a better model won't fix them. A chat session never knows your site's running baseline. That belongs in the analytics layer.
There's also a more basic problem. Even with flawless reasoning, an AI fed raw page views and sessions can only recommend more: "write more of what drove traffic." That's the traffic illusion again, only now it's automated and delivered with great confidence.
A connector changes the interface. It doesn't change the intelligence.
Why Third-Party Tools Hit a Structural Limit
Put these blind spots together and the pattern is clear. A typical third-party analytics tool shows the following downsides:
- Missing of a large share of your audience, because it depends on cookies and consent, and script blockers filter it out;
- Reporting of mostly descriptive metrics such as page views, unique users and dwell time, which describe volume but not quality;
- Lack of knowledge regarding your content, because it sees URLs, not the content elements, structure and context behind them, so events can't be reliably tied to what visitors actually engaged with;
- Provision of the wrong foundation for AI: raw exports with no baseline and no validated calculations.
These aren't configuration problems. They're built into the approach.
The Solution: Integrated, Not Bolted on — TYPO3 Analytics
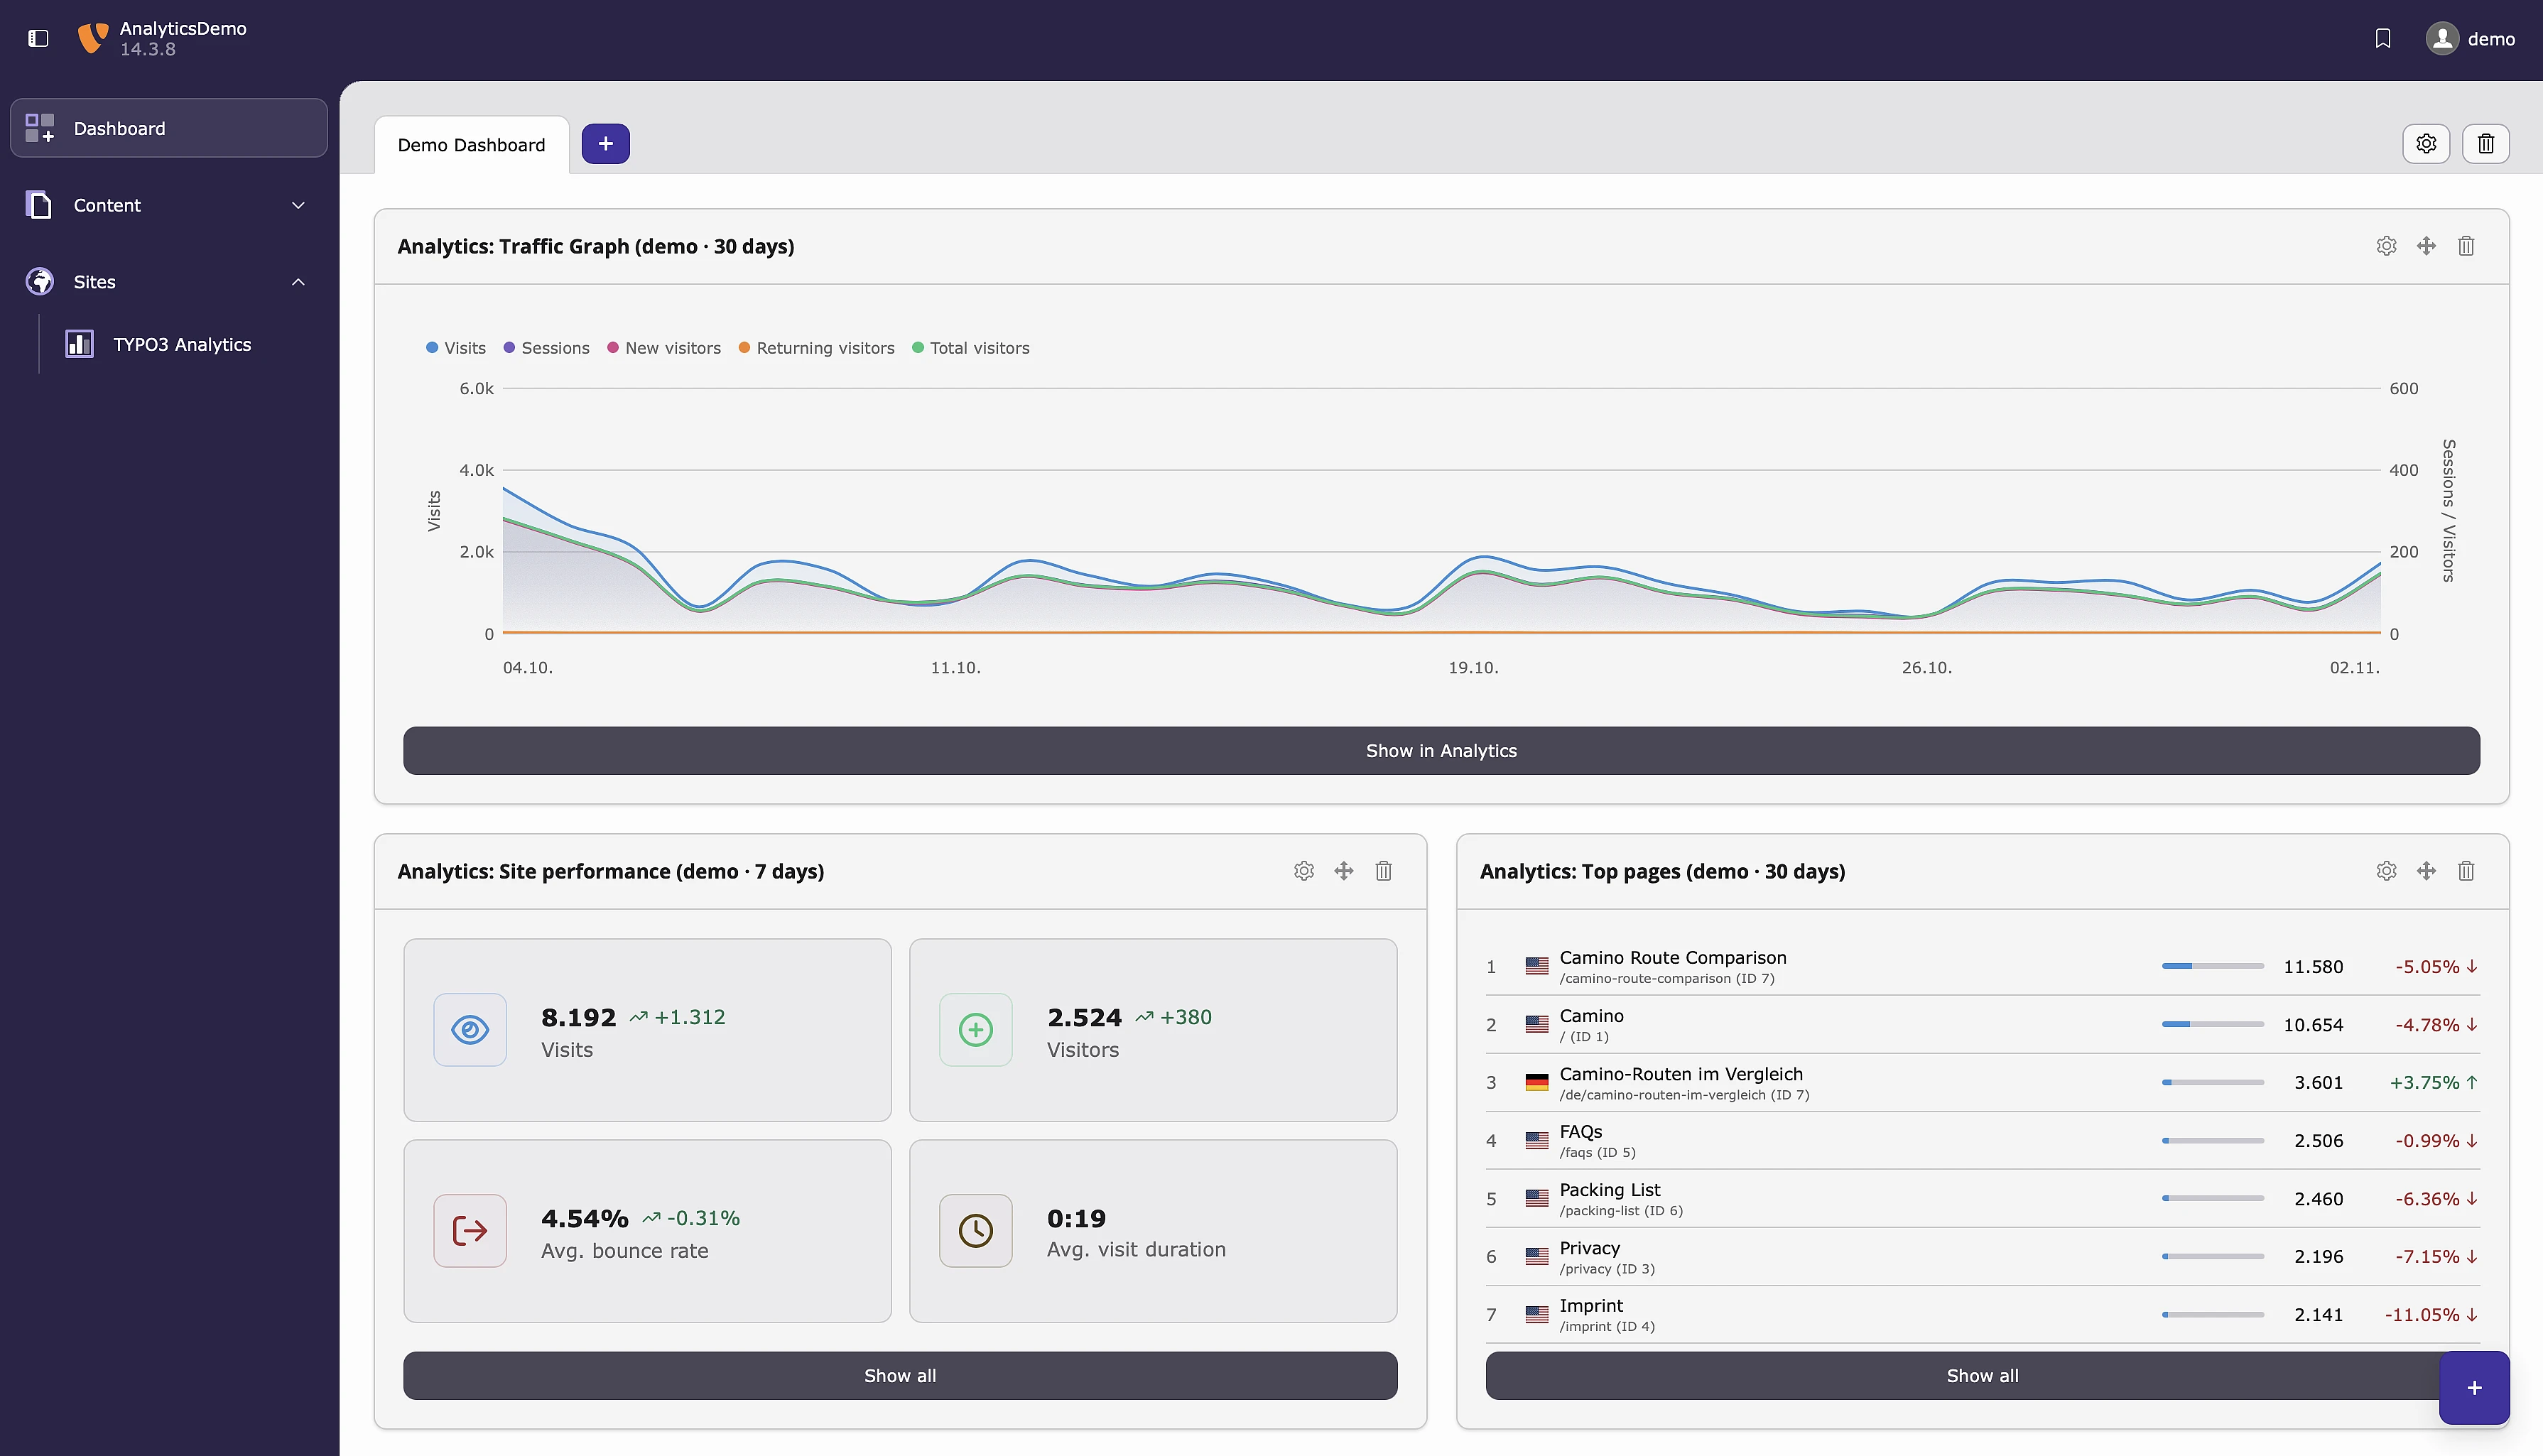
TYPO3 Analytics takes a different approach and follows the order that actually leads to reliable insights:
1. Complete data. In its default privacy mode, TYPO3 Analytics works without cookies or fingerprinting, so measurement doesn’t depend on a consent banner that visitors decline. You see far more of your real audience, not a self-selected minority.
2. Behavioural signals. Scroll depth, active viewport time, continuation, frustration events, heatmaps and scroll maps show not just how many people came, but whether your content worked.
3. Integrated into your CMS. Because TYPO3 Analytics lives where your content lives, behaviour can be tied directly to pages and content, without a separate tool, a separate data silo or guesswork about which event belongs to which element.
4. Validated models before AI. Baselines and calculations happen in the analytics layer, before any AI gets involved. AI built on validated analytics gives you answers you can trust, not just answers that sound plausible.
Complete data. Behavioural signals. Validated mathematical models. In that order.
Why TYPO3 Analytics Needs No Consent Banner
“Cookie-free” is often used as a marketing label. For TYPO3 Analytics, it describes how the tool is built.
The rule behind consent banners is fairly simple. Under the EU ePrivacy Directive (in Germany: § 25 TDDDG), you need consent whenever information is stored on, or read from, a visitor’s device. Cookies, local storage and device fingerprinting all fall under this. The banner is not caused by analytics as such. It is caused by accessing the device.
In its default privacy mode, TYPO3 Analytics does none of this:
- No cookies, no local storage. Nothing is written to the visitor’s browser.
- No fingerprinting. Device and browser characteristics are not combined to recognise visitors again.
- No cross-site tracking. Data stays within your own website and isn’t used to build profiles across other sites.
Nothing is stored on or read from the device, so there’s no consent requirement to trigger. Visitors are measured from their first page view, including everyone who would have clicked “decline”.
In short: Some tools say they are “GDPR-compliant” and still need a banner. TYPO3 Analytics doesn’t need one, because it never stores or reads identifiers on the visitor’s device.
Key Takeaways: What to Address in Your Next Analytics Meeting
You don't need a big overhaul. Start small:
- Find your blind spot. Compare your analytics data with server-side or log data. The gap is your blind spot, and it's usually bigger than you'd expect.
- Pick one page and ask the three questions. Choose a high-traffic page. Are visitors reading it? Where does attention drop? Does it lead anywhere? Whatever you can't answer is where you start.
- Change one thing and check whether it worked. Compare against your own baseline, not an industry benchmark. That one loop of analyse, act and verify is the reactive approach at its smallest.
One page, three questions, one targeted change.
Want to see what your current analytics setup is missing?
